Field Log · Entry
Agent Observability: Trace·Span·Event로 실패 재현하기 (8/10)
오늘의 결론
- Log, metric, trace, artifact는 서로 대체하는 것이 아니라 같은 run을 다른 각도에서 설명합니다.
- Trace는 요청 하나의 인과 관계, span은 한 operation, event는 span 안의 순간, artifact는 큰 입력·출력·상태를 담습니다.
model,prompt,tool schema,index,policy,stateversion이 없으면 같은 실패를 재현할 수 없습니다.- Prompt와 문서 원문을 기본적으로 telemetry에 넣지 않습니다. hash·ID·길이·등급을 우선 기록하고 필요한 원문은 접근 통제된 artifact store로 분리합니다.
- Dashboard는 평균 latency보다 task success, 최초 실패 단계, no-progress loop, tool error, 비용 분포를 보여 줘야 합니다.
앞 글에서는 process가 죽어도 checkpoint와 event에서 run을 재개했습니다. 하지만 재개는 됐는데 답이 틀렸다면 어디서부터 조사해야 할까요?
최종 답변: “해당 계약은 자동 갱신됩니다.”

가능한 원인:
- router가 정책 검색을 건너뜀
- query rewrite가 계약 번호를 잃음
- retriever가 과거 revision을 반환
- reranker가 근거 문단을 제거
- model이 충분한 evidence를 무시
- tool retry가 다른 snapshot을 읽음
마지막 오류 문자열 하나로는 이 후보를 구분할 수 없습니다. Agent observability의 목표는 “무슨 로그가 찍혔나?”보다 **어느 state와 version에서 어떤 decision이 어떤 observation을 만들었나?**에 답하는 것입니다.
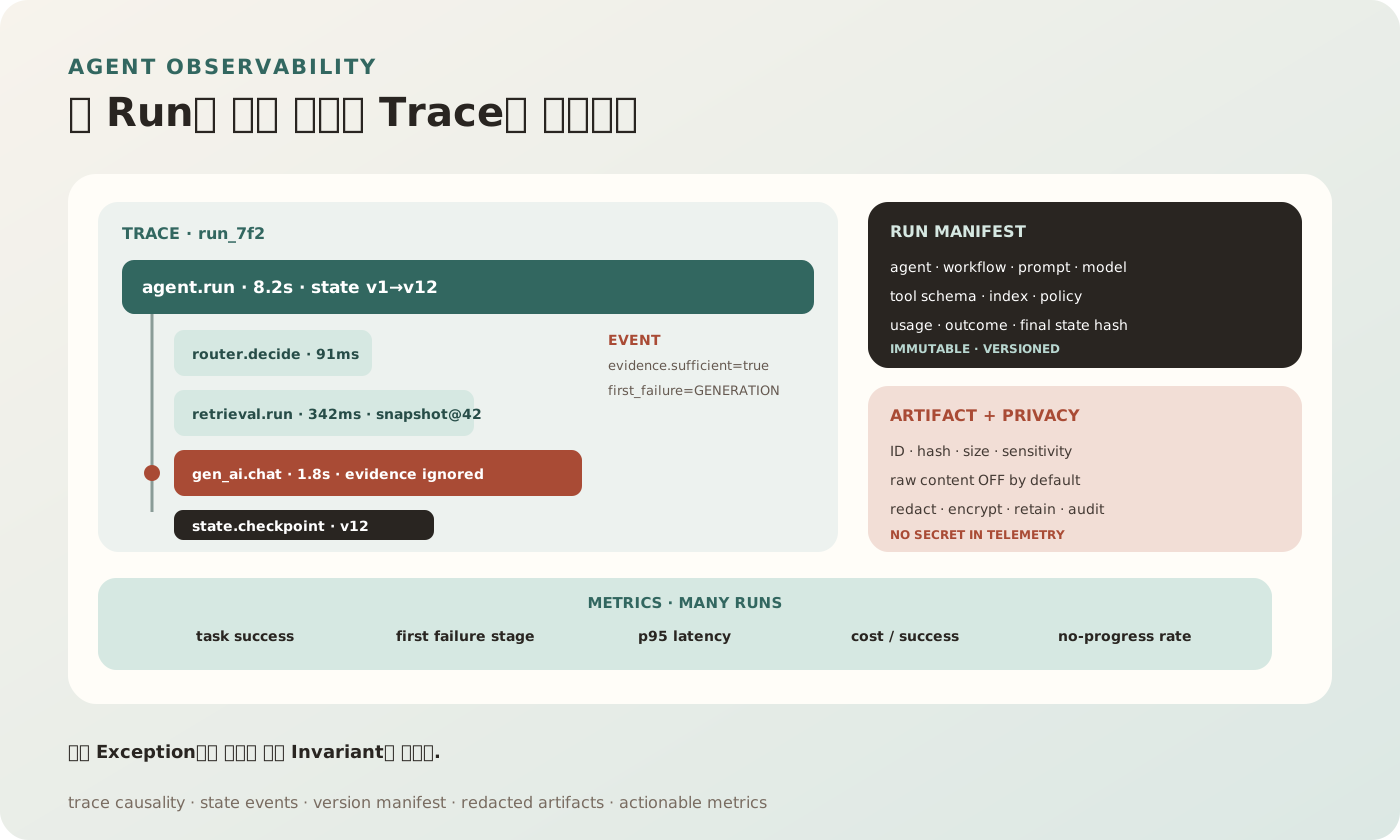
그림 1. Trace tree는 operation의 인과 관계를, event는 state transition을, artifact와 manifest는 큰 payload와 version을, metric은 집계된 운영 상태를 설명한다.
Observability와 단순 Logging의 차이
Monitoring은 미리 정한 질문에 답합니다.
p95 latency가 임계치를 넘었는가?
tool error rate가 증가했는가?
이번 시간의 token cost는 얼마인가?
Observability는 예상하지 못한 실패도 내부 신호를 조합해 설명할 수 있는 성질입니다.
왜 특정 tenant의 복합 질문에서만
router가 web search를 선택하고
retrieval snapshot이 바뀐 뒤
unsupported answer가 늘었는가?
Agent는 한 HTTP request 안에서 끝나지 않을 수 있습니다. Queue, child run, human approval, retry, 여러 provider를 건너므로 구조화된 상관관계가 필요합니다.
네 가지 신호를 구분하기
1. Trace와 Span
Trace는 한 user goal이 처리된 전체 경로입니다. Span은 그 안의 operation 하나입니다.
trace: answer_policy_question
└─ span: agent.run
   ├─ span: route.query
   ├─ span: retrieval.search
   ├─ span: retrieval.rerank
   ├─ span: gen_ai.chat
   ├─ span: tool.call
   └─ span: state.checkpoint
각 span은 시작·종료 시각, parent, status, attributes, events를 가집니다. Parent-child 관계 덕분에 “rerank가 느렸다”와 “rerank 뒤 model이 시작됐다”를 함께 볼 수 있습니다.
2. Event
Span 안에서 특정 순간에 일어난 사실입니다.
evidence.threshold_not_met
retry.scheduled
approval.requested
budget.warning
state.transition
tool.receipt_recorded
Operation 전체를 별도 span으로 만들 가치가 없지만 시간과 payload가 중요한 순간에 씁니다.
3. Metric
많은 run을 집계한 수치입니다.
agent.task.success.rate
agent.run.duration
agent.step.count
agent.tool.error.rate
agent.cost.usd
agent.no_progress.rate
retrieval.evidence.sufficiency
Metric은 추세와 alert에 좋지만 특정 실패의 세부 인과 관계는 trace로 이동해 조사합니다. 가능하면 metric exemplar에 대표 trace ID를 연결합니다.
4. Log와 Artifact
Log는 구조화된 독립 record입니다. Artifact는 telemetry attribute에 넣기 너무 크거나 민감한 자료입니다.
normalized request
selected chunk ID list
prompt rendering
model raw response
tool request/response
state checkpoint
evaluation report
Artifact는 별도 store에 암호화하고 trace에는 artifact_id, hash, size, sensitivity, retention만 둡니다.
| 신호 | 가장 잘 답하는 질문 | 보존 방식 |
|---|---|---|
| Trace/Span | 이 요청에서 어디가 느리고 실패했나? | sampling된 구조화 record |
| Event | state가 언제 왜 바뀌었나? | parent span에 결합 |
| Metric | 전체 품질·비용 추세가 어떤가? | 집계 time series |
| Log | 독립적인 system event가 무엇인가? | indexed structured record |
| Artifact | 실제 입력·출력·상태는 무엇인가? | 통제된 object store |
Trace의 Root를 User Goal에 맞추기
HTTP endpoint 하나를 root로 잡으면 human approval 뒤 resume가 별도 trace로 끊길 수 있습니다. 다음 ID를 구분합니다.
run_id       : 논리적인 Agent 실행
trace_id     : 한 분산 추적 그래프
request_id   : 개별 transport 요청
thread_id    : 대화·checkpoint namespace
user_goal_id : 사용자가 달성하려는 업무 목표
한 run을 한 trace로 유지할 수 없을 때는 span link로 이전 trace, async message, child run을 연결합니다. traceparent와 tracestate 같은 W3C Trace Context header는 서비스 경계를 건너 trace context를 전달하는 표준입니다.
외부에서 온 trace header를 그대로 신뢰하지 말고 길이·형식을 검증하며 tenant boundary에서 propagation policy를 적용합니다.
권장 Span Tree
agent.run
├─ input.normalize
├─ policy.precheck
├─ router.decide
│  └─ gen_ai.classify
├─ plan.create
│  └─ gen_ai.chat
├─ retrieval.run
│  ├─ query.transform
│  ├─ vector.search
│  ├─ lexical.search
│  ├─ result.fuse
│  └─ result.rerank
├─ evidence.assess
├─ tool.execute
│  ├─ authorization.check
│  └─ http.client
├─ answer.generate
│  └─ gen_ai.chat
├─ answer.verify
├─ memory.write
└─ state.checkpoint
모든 함수에 span을 만들면 noise와 비용이 커집니다. 다음 중 하나에 해당할 때 operation span을 만듭니다.
- network·queue·storage 경계를 넘는다.
- 비용이 발생한다.
- 독립적인 timeout·retry가 있다.
- 중요한 policy decision이다.
- 병목 또는 실패를 따로 측정해야 한다.
순수한 작은 helper는 parent span의 event나 attribute로 충분합니다.
Span 이름과 Attribute를 안정적으로 만들기
나쁜 span 이름:
GET /users/84921/contracts/773
call gpt-5 with “김철수 계약…”
tool customer_84921_refund
고유값이 이름에 들어가 cardinality와 개인 정보 문제가 생깁니다.
좋은 span 이름:
retrieval.search
gen_ai.chat
tool.execute refund.create
state.checkpoint
고유값은 허용된 attribute에 넣거나 hash·bucket으로 바꿉니다.
공통 Run Attributes
{
  "agent.run.id": "run_7f2",
  "agent.name": "policy-assistant",
  "agent.version": "3.4.1",
  "agent.state.version": 12,
  "agent.workflow.version": "wf_2026_07_16",
  "tenant.id_hash": "hmac:...",
  "environment": "production",
  "risk.tier": "R2"
}
Model Span Attributes
{
  "gen_ai.provider.name": "provider-name",
  "gen_ai.request.model": "model-id",
  "gen_ai.response.model": "resolved-model-id",
  "gen_ai.operation.name": "chat",
  "gen_ai.request.max_tokens": 900,
  "gen_ai.usage.input_tokens": 2180,
  "gen_ai.usage.output_tokens": 412,
  "agent.prompt.version": "answer@18",
  "agent.tool_schema.version": "tools@7",
  "agent.response.hash": "sha256:..."
}
위 model attribute의 검토 기준은 2026-09-08의 GenAI semantic conventions commit b5d8440입니다. 기존 semantic-conventions 저장소의 v1.44.0 문서는 별도 GenAI 저장소로 이동했음을 안내합니다. 이 글의 agent.run, router.decide, evidence.assess 같은 전체 span tree는 애플리케이션 설계 예이며 모든 이름이 OTel 표준이라는 뜻은 아닙니다.
규약의 항목별 안정성은 다를 수 있습니다. 실제 release manifest에는 이 문서 검토 commit 외에도 설치한 OTel SDK·instrumentation 버전, 사용 schema URL, 애플리케이션 attribute schema 버전을 따로 기록하세요. 문서 commit을 고정했다고 SDK가 그 규약을 자동 적용하지는 않습니다. Upgrade 때는 export한 span fixture로 이름·단위·개인정보 수집 정책의 변경을 검토합니다.
Retrieval Span Attributes
{
  "retrieval.index.id": "policy-ko",
  "retrieval.index.version": "snapshot_20260716_02",
  "retrieval.query.hash": "sha256:...",
  "retrieval.top_k": 20,
  "retrieval.returned": 20,
  "reranker.version": "rr_9",
  "evidence.selected": 5,
  "evidence.coverage": 0.83,
  "evidence.sufficient": true
}
Tool Span Attributes
{
  "tool.name": "refund.create",
  "tool.version": "2.1",
  "tool.call.id": "call_90",
  "tool.action.id": "action_12",
  "tool.attempt": 2,
  "tool.idempotency_key_hash": "hmac:...",
  "tool.effect.class": "WRITE_REVERSIBLE",
  "tool.receipt.id": "receipt_91",
  "tool.outcome": "committed"
}
실제 secret, access token, 전체 idempotency key는 넣지 않습니다.
State Transition을 Event로 기록하기
State가 바뀌었는데 이유가 없으면 trace는 예쁜 waterfall에 그칩니다.
{
  "event": "agent.state.transition",
  "from": "ACTING",
  "to": "WAITING_RETRY",
  "reason_code": "UPSTREAM_RATE_LIMITED",
  "state_version_before": 11,
  "state_version_after": 12,
  "caused_by_span_id": "span_tool_2",
  "policy_version": "retry@4",
  "remaining_steps": 3
}
Free-form reason만 남기지 말고 stable reason code와 optional message를 분리합니다. 그래야 집계와 alert가 가능합니다.
중요 event:
- route selected / changed
- evidence accepted / rejected
- no-progress detected
- retry scheduled / exhausted
- approval requested / granted / expired
- capability denied
- checkpoint committed / conflict
- cancellation received / propagated
- terminal outcome decided
Run Manifest를 불변 Artifact로 남기기
Trace는 sampling되거나 retention이 짧을 수 있습니다. 최종 결과와 재현 조건을 묶은 작은 manifest를 run마다 남깁니다.
{
  "run_id": "run_7f2",
  "trace_id": "4bf92f...",
  "started_at": "2026-07-16T10:02:11Z",
  "completed_at": "2026-07-16T10:02:19Z",
  "outcome": "SUCCEEDED",
  "versions": {
    "agent": "3.4.1",
    "workflow": "wf_2026_07_16",
    "prompt": "answer@18",
    "model": "resolved-model-id",
    "tools": "tools@7",
    "retrieval_index": "snapshot_20260716_02",
    "reranker": "rr_9",
    "policy": "policy@12"
  },
  "usage": {"steps": 6, "input_tokens": 8120, "output_tokens": 930, "usd": 0.084},
  "artifacts": ["artifact://evidence/e_42", "artifact://answer/a_77"],
  "final_state_hash": "sha256:..."
}
Manifest 자체도 schema version과 integrity hash를 가집니다. 나중에 평가 결과를 원본에 덮어쓰지 말고 evaluation_id → run_id로 연결합니다.
민감정보를 남기지 않는 Telemetry
기본 원칙
raw content off by default
stable ID보다 keyed hash
secret은 절대 기록하지 않음
민감 artifact는 별도 access control
환경별 retention과 sampling
export 전에 redaction
Prompt·completion capture를 켜야 디버깅할 수 있다는 주장은 절반만 맞습니다. 먼저 아래 값으로 문제를 좁힐 수 있습니다.
- template version
- input/output token count
- request·response hash
- finish reason
- evidence IDs와 source revision
- selected tool 이름과 schema version
- error class와 status code
원문이 꼭 필요한 high-severity incident만 audited break-glass access로 artifact를 열도록 설계할 수 있습니다.
Redaction은 Exporter 직전에만 하지 않기
원문이 여러 processor를 거친 뒤 마지막 exporter에서만 지워지면 그 이전 buffer와 log에는 남을 수 있습니다.
instrumentation allowlist
→ in-process scrub
→ collector policy
→ backend ingestion rule
→ retention·access control
여러 층에서 방어하고 redaction failure 자체를 metric으로 측정합니다.
Cardinality Budget
Metric label에 run_id, query, document ID를 넣으면 time series 수가 폭발합니다. High-cardinality 값은 trace attribute로 두고 metric에는 낮은 cardinality 차원만 사용합니다.
좋음: environment, agent_version, tool_name, error_class, risk_tier
나쁨: user_id, run_id, prompt_text, document_id, full_url
Sampling Strategy
모든 production trace를 영구 보관하기는 어렵습니다.
Head sampling
요청 시작 시 sampling 여부를 정합니다. 싸지만 나중에 실패한 trace를 놓칠 수 있습니다.
Tail sampling
trace가 끝난 뒤 outcome, latency, risk를 보고 결정합니다.
권장 규칙 예:
100%  security denial / write action / user complaint
100%  error / timeout / compensation / no-progress
100%  canary version
20%   high latency or high cost
1%    routine successful read-only run
Sampling decision에는 reason을 남기고, metric은 trace sampling과 별도로 정확히 집계합니다. 특정 tenant나 사용자만 과도하게 수집하지 않도록 privacy impact도 검토합니다.
“최초 실패 단계”를 계산하기
마지막 exception은 원인이 아니라 결과일 수 있습니다.
router 오분류
→ retrieval 생략
→ evidence 부족
→ model 추측
→ verifier 실패
→ 최종 UNSUPPORTED_ANSWER
Trace 분석은 가장 이른 violated invariant를 찾습니다.
FAILURE_PRECEDENCE = [
    "INPUT_INVALID",
    "ROUTE_INCORRECT",
    "PLAN_INVALID",
    "RETRIEVAL_MISS",
    "EVIDENCE_INSUFFICIENT",
    "TOOL_FAILURE",
    "GENERATION_UNSUPPORTED",
    "VERIFICATION_FAILURE",
    "BUDGET_EXHAUSTED",
]

def first_failure(events):
    violations = [event for event in events if event.get("invariant_violated")]
    return min(violations, key=lambda event: event["sequence"]) if violations else None
시간상 최초 event가 항상 의미상 root cause인 것은 아닙니다. caused_by_span_id, state version, dependency edge를 함께 사용해 causal chain을 만듭니다.
Agent에 필요한 핵심 Metric
품질
- task success rate
- grounded/unsupported answer rate
- evidence sufficiency rate
- route accuracy
- tool argument validity
- human correction rate
신뢰성
- run completion rate
- retry exhaustion rate
- checkpoint conflict rate
- duplicate effect prevented count
- compensation rate
- no-progress loop rate
효율
- end-to-end p50/p95/p99 latency
- time to first useful action
- step count distribution
- input/output tokens
- cost per successful task
- retrieval·model·tool별 latency와 비용
성공하지 못한 run 비용을 성공 비용 평균에서 빼면 실제 unit economics가 왜곡됩니다.
cost per successful task
= total cost of all attempts / number of successful tasks
Dashboard와 Alert를 질문 중심으로 만들기
Executive view
task success · p95 latency · cost/success · security incidentsAgent funnel
started → routed → evidence sufficient → tool success → verified → completedFailure map
first failure stage × agent version × route × tool × risk tierRelease comparison
baseline vs canary:
success Δ · p95 Δ · cost Δ · no-progress Δ · denial Δ
Alert는 증상과 행동을 연결합니다.
조건: refund.create UNKNOWN outcome > 0
행동: 해당 tool의 write lane 일시 중지 + receipt reconciliation

조건: evidence insufficient rate가 snapshot 배포 직후 3배
행동: index canary rollback + affected trace sample 보존
Instrumentation Wrapper 예시
from opentelemetry import trace

tracer = trace.get_tracer("policy-agent", "3.4.1")

def execute_tool(state, action, tool):
    with tracer.start_as_current_span(
        f"tool.execute {tool.stable_name}",
        attributes={
            "agent.run.id": state.run_id,
            "agent.state.version": state.version,
            "tool.name": tool.stable_name,
            "tool.version": tool.version,
            "tool.action.id": action.action_id,
            "tool.attempt": action.attempt,
            "tool.effect.class": action.effect_class,
            "tool.input.hash": action.input_hash,
        },
    ) as span:
        try:
            receipt = tool.invoke(action.safe_payload)
            span.set_attribute("tool.outcome", receipt.status)
            span.set_attribute("tool.receipt.id", receipt.receipt_id)
            span.add_event(
                "tool.receipt_recorded",
                {"state.version.after": state.version + 1},
            )
            return receipt
        except Exception as error:
            failure = classify_error(error)
            span.set_attribute("error.type", failure.code)
            span.set_status(trace.Status(trace.StatusCode.ERROR, failure.safe_message))
            span.record_exception(error, attributes={"exception.escaped": True})
            raise
예시에서도 safe_payload, safe_message, hash를 사용합니다. SDK 기본 exception capture가 message와 stack에 secret을 포함할 수 있으므로 production redaction 정책을 검토해야 합니다.
Replay의 한계까지 기록하기
Trace가 있다고 완전한 재현이 자동으로 되지는 않습니다.
- model provider의 backend가 바뀔 수 있다.
- 같은 model ID도 weight snapshot이 달라질 수 있다.
- temperature 0도 완전한 결정성을 보장하지 않을 수 있다.
- web과 vector index 내용이 변한다.
- tool의 외부 state가 달라진다.
- time·locale·feature flag가 결과를 바꾼다.
그래서 replay mode를 구분합니다.
| Mode | 외부 호출 | 목적 |
|---|---|---|
| Exact trace replay | recorded observation 사용 | reducer·policy 재현 |
| Snapshot replay | 고정 model/index/tool fixture | release regression |
| Live replay | 현재 dependency 호출 | drift 확인, side effect 금지 |
| Counterfactual replay | 특정 stage만 교체 | router·prompt·retriever 비교 |
Write tool은 live replay에서 실행하지 않고 simulator 또는 read-only fixture를 사용합니다.
관측성 자체도 테스트하기
Completeness
- 모든 terminal run에 outcome과 manifest가 있는가?
- tool call에 action ID와 receipt가 연결되는가?
- retry attempt가 같은 logical action에 묶이는가?
- child run과 async message에 trace link가 있는가?
Correctness
- token 합계와 provider billing이 허용 오차 안에서 맞는가?
- span duration이 음수이거나 parent 밖에 있지 않은가?
- state version이 단조 증가하는가?
- error인데 span status가 OK로 남지 않는가?
Privacy
- canary secret 문자열이 telemetry backend에 나타나지 않는가?
- prompt capture off가 실제 exporter까지 유지되는가?
- 삭제 요청이 artifact와 search index에 전파되는가?
- tenant A가 tenant B trace를 조회할 수 없는가?
Usefulness
운영자에게 sample incident를 주고 root cause와 영향을 찾는 시간을 측정합니다. Signal을 많이 수집해도 조사 시간이 줄지 않으면 schema와 dashboard를 다시 설계해야 합니다.
흔한 실패 패턴
1. 최종 prompt와 answer만 저장
어떤 route와 tool observation을 거쳤는지 모릅니다.
처방: state transition과 operation span을 연결합니다.
2. 모든 값을 span attribute에 넣기
비용·cardinality·privacy 문제가 생깁니다.
처방: 작은 metadata는 attribute, 큰 payload는 통제된 artifact로 분리합니다.
3. Version 없는 Trace
현재 코드로 과거 run을 재실행해 다른 결과가 나와도 이유를 알 수 없습니다.
처방: model·prompt·tool·index·policy·workflow version을 manifest에 고정합니다.
4. Error가 난 Span만 100% 수집
논리적으로 틀렸지만 HTTP 200인 run과 느린 성공을 놓칩니다.
처방: evaluation outcome, risk, latency, cost를 포함한 tail sampling을 사용합니다.
5. 평균만 보는 Dashboard
긴 tail과 특정 tool의 failure cluster가 가려집니다.
처방: percentile, distribution, first-failure stage, version diff를 봅니다.
6. Trace가 곧 Replay라고 가정
변하는 model·index·tool state 때문에 재현이 갈라집니다.
처방: manifest, recorded observation, snapshot fixture, replay mode를 둡니다.
Production 체크리스트
- run, trace, request, thread, user goal ID를 구분했다.
- router·retrieval·model·tool·checkpoint의 핵심 span tree가 있다.
- state transition에 stable reason code와 state version을 기록한다.
- model·prompt·tool schema·index·policy·workflow version을 남긴다.
- token·cost·latency·attempt·outcome을 stage별로 측정한다.
- raw prompt·completion capture는 기본 off다.
- secret과 PII를 instrumentation·collector·backend 여러 층에서 제거한다.
- 큰 evidence·state·payload는 access-controlled artifact로 분리한다.
- metric label의 cardinality budget이 있다.
- error·security·write·no-progress trace를 우선 보존한다.
- first failure stage와 causal link를 계산한다.
- task success, cost/success, no-progress, duplicate prevention을 본다.
- run manifest와 final state hash를 불변 record로 남긴다.
- exact·snapshot·live·counterfactual replay를 구분한다.
- telemetry completeness·correctness·privacy를 자동 테스트한다.
스스로 확인하기
- Span과 event를 나누는 기준은 무엇인가?
- Prompt 원문 없이도 먼저 기록할 수 있는 재현 정보 다섯 가지는 무엇인가?
- Metric label에
run_id를 넣으면 어떤 문제가 생기는가? - 최종 error보다 최초 violated invariant가 중요한 이유는 무엇인가?
- 여러분의 Agent에서 반드시 100% 보존해야 할 trace는 어떤 유형인가?
다음 글에서는 retrieved document와 tool result를 untrusted input으로 취급하고, prompt injection, capability, taint, approval, 실행 직전 authorization으로 부작용 경계를 지킵니다.
참고자료
Reader questions
읽으며 남긴 질문
글을 읽으며 붙잡아 둔 질문입니다. 다시 살펴보거나, 보내지 않은 질문을 한 번에 블로그 주인에게 전달할 수 있습니다.